Infographic
Here is one of my Data Analysis projects where I created an infographic
Click here to view the map on Mapbox
As someone who strongly believes that having access to food is a human right, I chose to compare the number of homeless shelters [1] and free and low-cost food program locations [2] in the city of Vancouver in British Columbia. I have previously volunteered at a homeless shelter, once to make meals and other times to serve them. As such, I find this topic to be one of the most engaging comparisons to research.
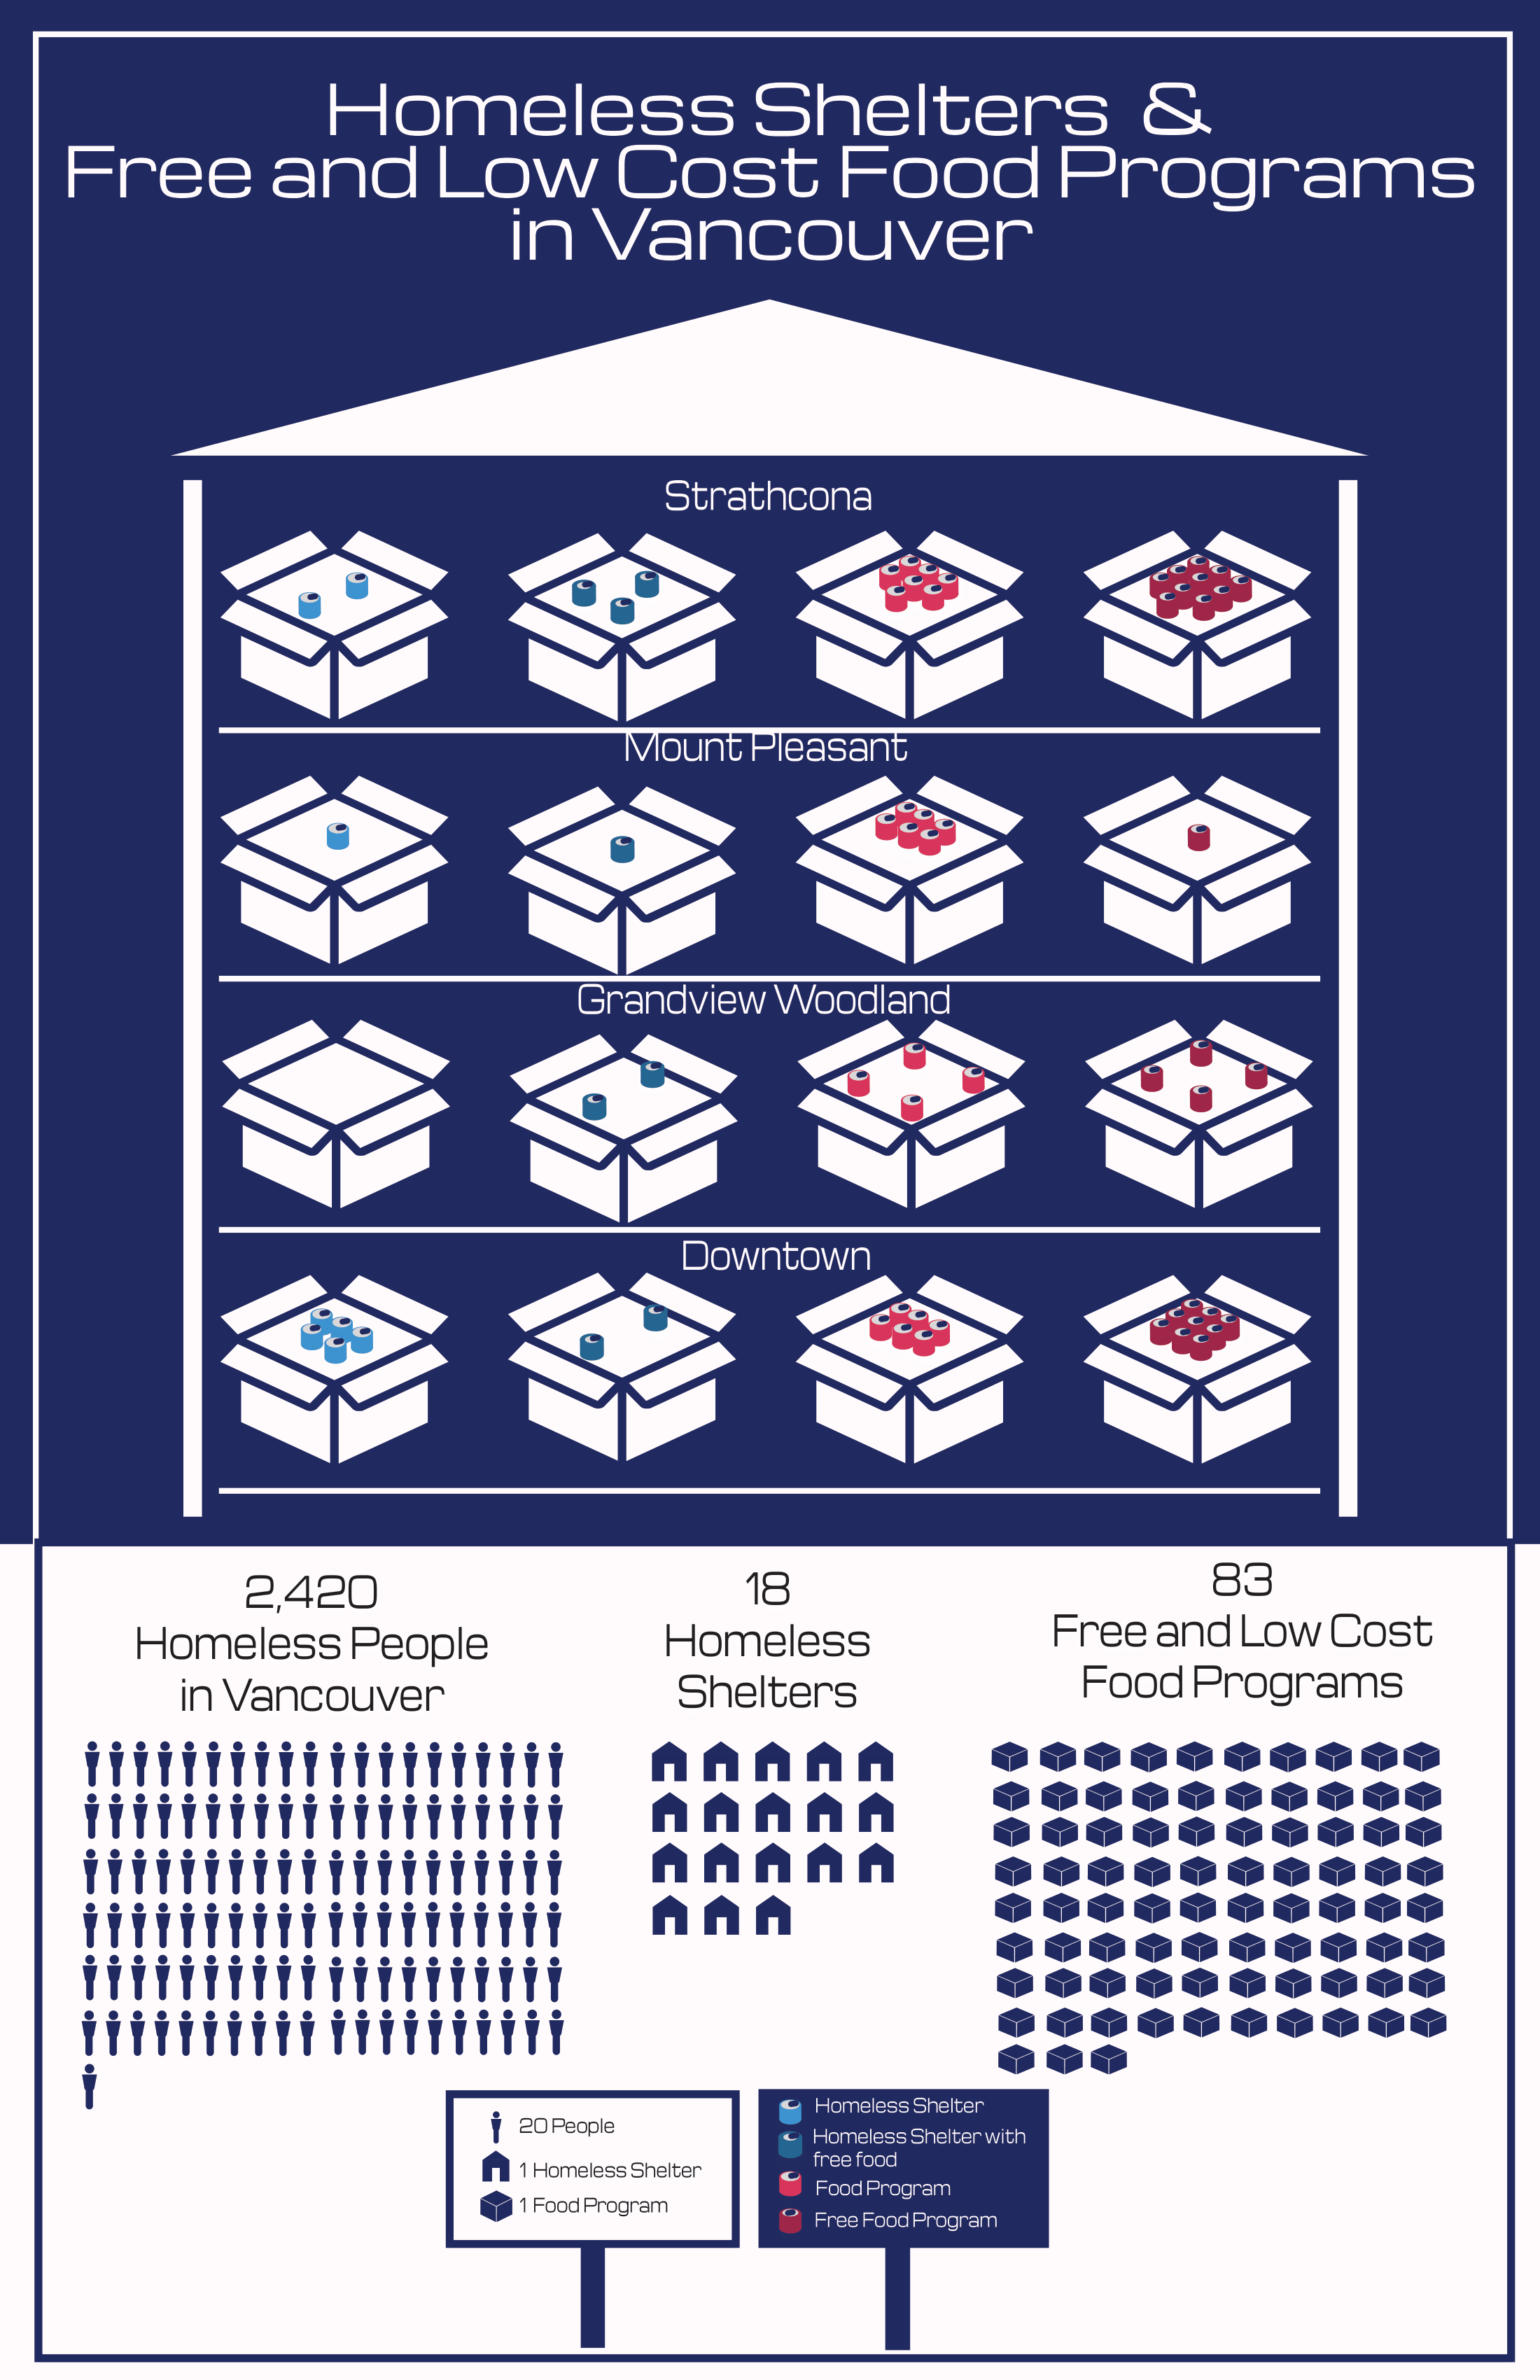
After settling on my topic, I went through many drafts. My previous mood board and illustration projects have shown information in a very thematic and direct way, and I wanted to continue that theme. Since my main focus is around food, and most donated foods are non-perishable and canned, I chose to illustrate a pantry with the most common pantry items: cans. This infographic is separated into two parts, the main one showing donated food in a shelter in the neighbourhoods with the most homeless shelters and food programs combined, and the second with illustrated statistics. As users scan information from top to bottom, I wanted to put the most artistic piece on top, then follow with words, and then with more icons.
As for the art style, I wanted to opt for a simple, modern aesthetic. I looked at colour palettes that are cohesive with navy [3] and used those five colours throughout my infographic. Since this is a serious topic, I chose to make everything have sharp edges, except for the cans. I created all of the icons myself, except for the boxes [4] to continue familiarising myself with Adobe Illustrator tools.
Through additional research, I found that as of October 31, 2023, the homeless population is 2,420 people [5], and in that same year, the metro area population is 2,657,000 [6]. This means that homeless people make up less than one percent of the total population. Based on this, it would seem that Vancouver has good solutions and resources for homeless people. Nevertheless, I found the proportion of homeless people in homeless shelters and food programs astounding. Luckily, there are a little more than four times the free and low-cost food programs. In addition, the data shows that about a little less than half of the homeless shelters and food programs provide free food. One thing to note is that the datasets did not specify how many people each shelter can hold, nor how many people the food programs feed on average.
To draw from the conclusions of these datasets and make educated guesses, it would seem as though Vancouver’s steady climate would allow homeless people to live outside comfortably for most of the year. However, with the surface-level information given, it would be fair to assume that the homeless population seems to be fed or have good support based on the available programs. Location-wise, most homeless shelters and food programs are located in the north of Vancouver, indicating higher demand. Finally, this infographic visualises where to address housing problems and provide meal support.
[1] City of Vancouver, “Homeless shelter locations,” City of Vancouver. [Online]. Available: https://opendata.vancouver.ca/explore/dataset/homeless-shelter-locations/information/. Accessed June 6, 2024.
[2] City of Vancouver, “Free and low cost food programs,” City of Vancouver. [Online]. Available: https://opendata.vancouver.ca/explore/dataset/free-and-low-cost-food-programs/information/. Accessed: June. 7, 2024.
[4]. J. Nur, “open box“, the Noun Project. [Online]. Available: https://thenounproject.com/icon/open-box-6522026/. Accessed June 21, 2024.
[3] J. Gaskin “20+ Best Blue Color Palettes for 2024”, Venngage. [Online]. Jan 30, 2024. Available: https://venngage.com/blog/blue-color-palettes/. Accessed June 21, 2024.
[5] C. Mauboules and Lupick, D, “2023 Homeless Count: Vancouver,” City of Vancouver. [Online]. October 31, 2023. Available: https://council.vancouver.ca/20231031/documents/regu20231031p1_2023_Homeless_Count.pdf. [PDF]. Accessed: June 9, 2024
[6] “Vancouver, Canada Metro Area Population 1950-2024”, Macrotrends. [Online]. Available: https://www.macrotrends.net/global-metrics/cities/20404/vancouver/population. Accessed June 21, 2024.